Tools
Overview
The Tools feature is the heart of MCP Explorer—it’s designed for testing and debugging MCP server implementations. Execute tools, inspect responses, search JSON output, and auto-generate documentation.
Key Capabilities
✅ Browse All Tools
View all available tools from connected MCP servers
🔍 Search & Filter
Find tools quickly by name or description
⭐ Favorites
Mark frequently-used tools for instant access
🎯 Dynamic Parameters
Auto-generated forms based on tool input schemas
📋 Parameter Persistence
Previous values saved automatically for quick re-testing
🔎 Response Search
Search within JSON responses in real-time
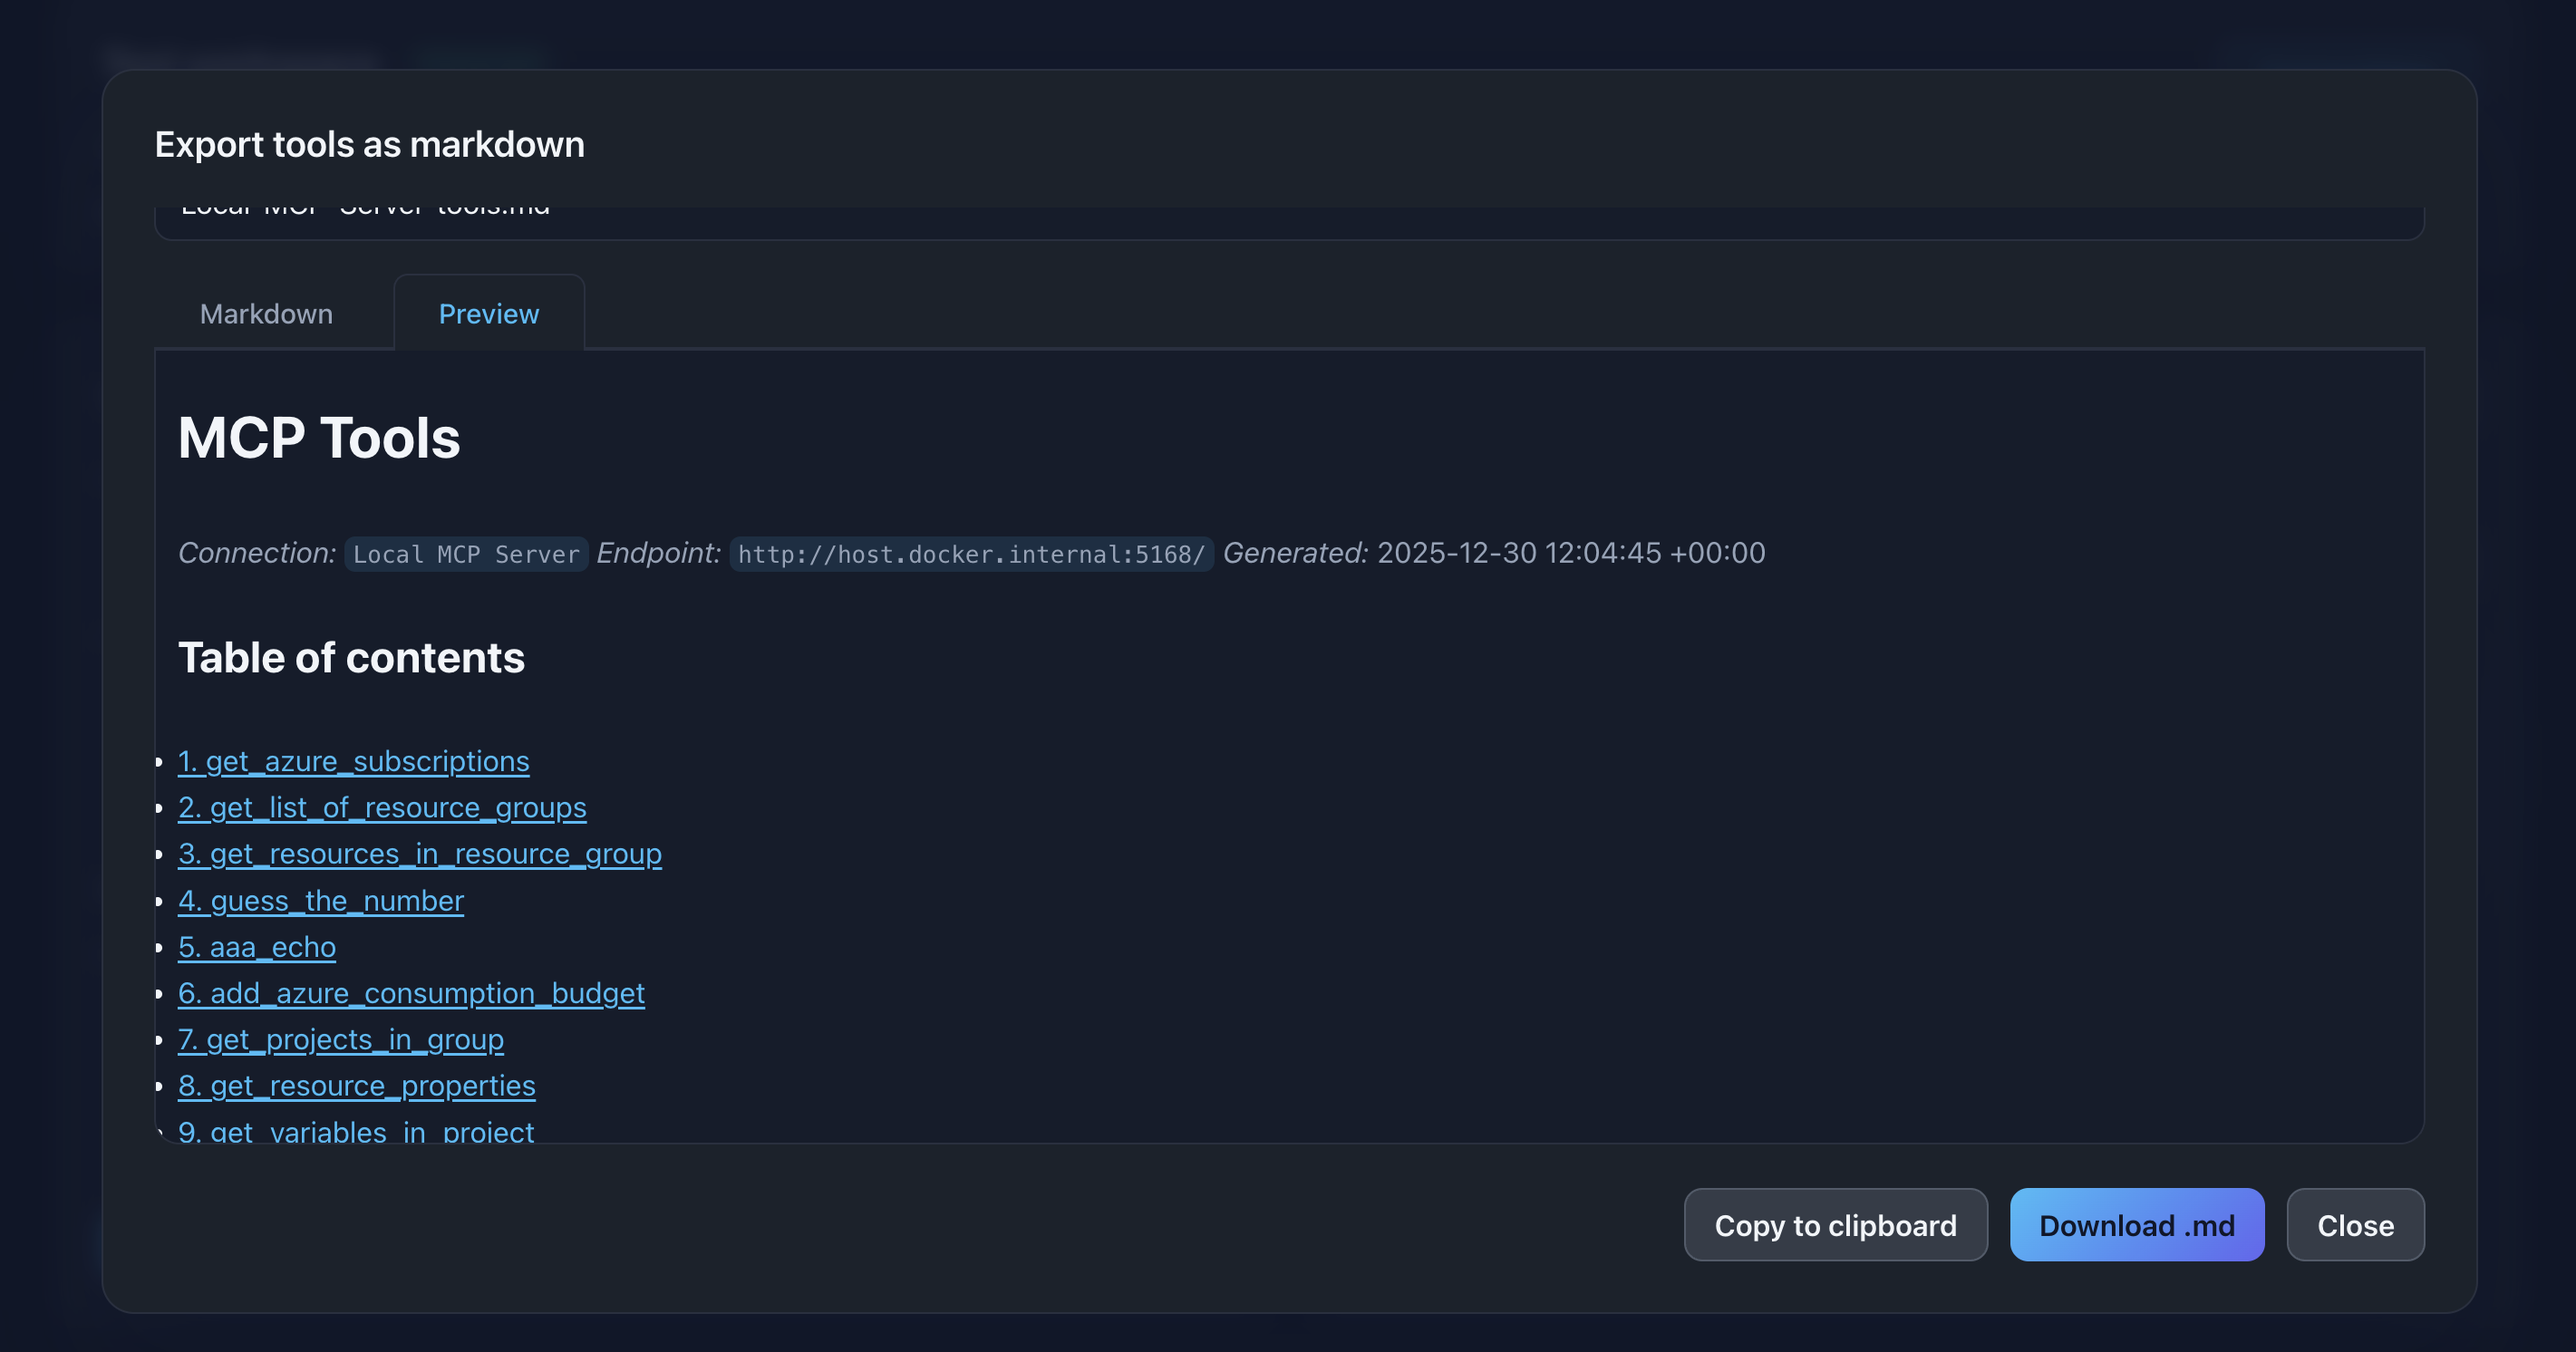
📄 Auto-Generated Documentation
View complete tool schemas and parameter details
📑 Copy Tool Names
Click to copy tool names to clipboard for use elsewhere
Getting Started
Step 1: Connect to a Server
- Navigate to 🔌 Connections tab
- Select a connection
- Click Connect
- Return to 🛠️ Tools tab
📸 Screenshot:
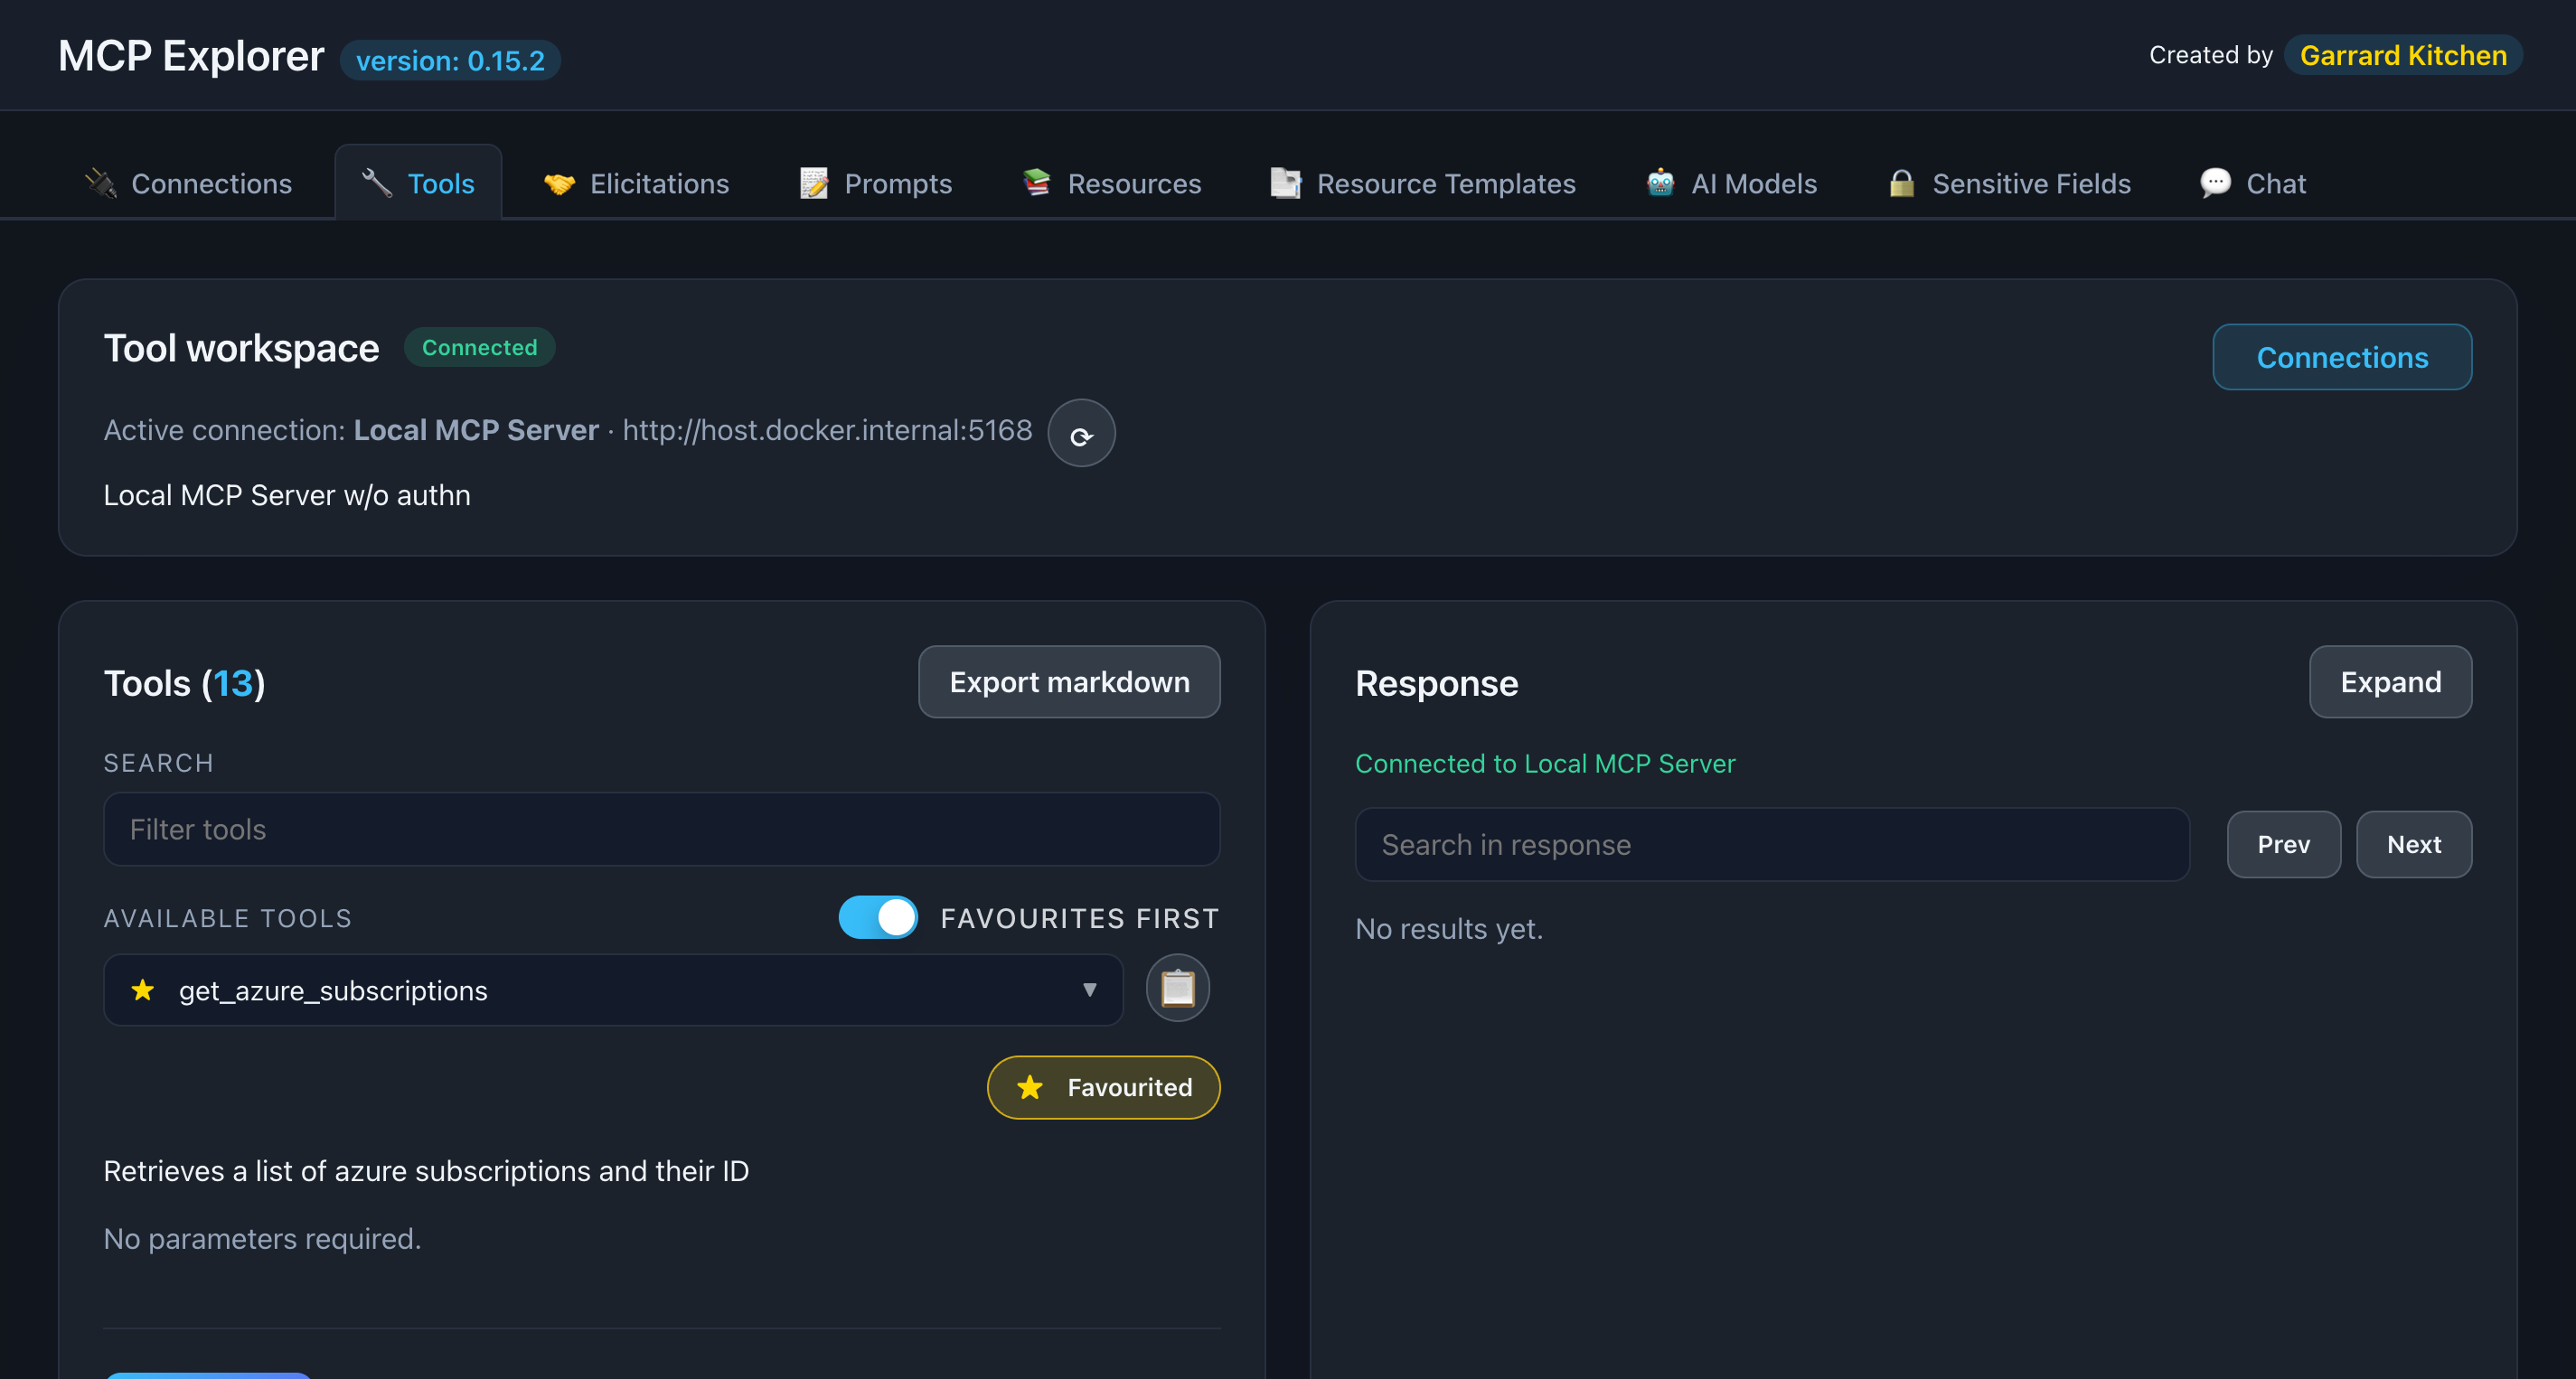
Description: Show the Tools tab with a connected server, displaying the list of available tools in the left sidebar
Step 2: Browse Available Tools
Once connected, you’ll see:
- Tool list in the left sidebar
- Tool count badge at the top
- Search box for filtering
- Favorite star icon for each tool
📸 Screenshot:
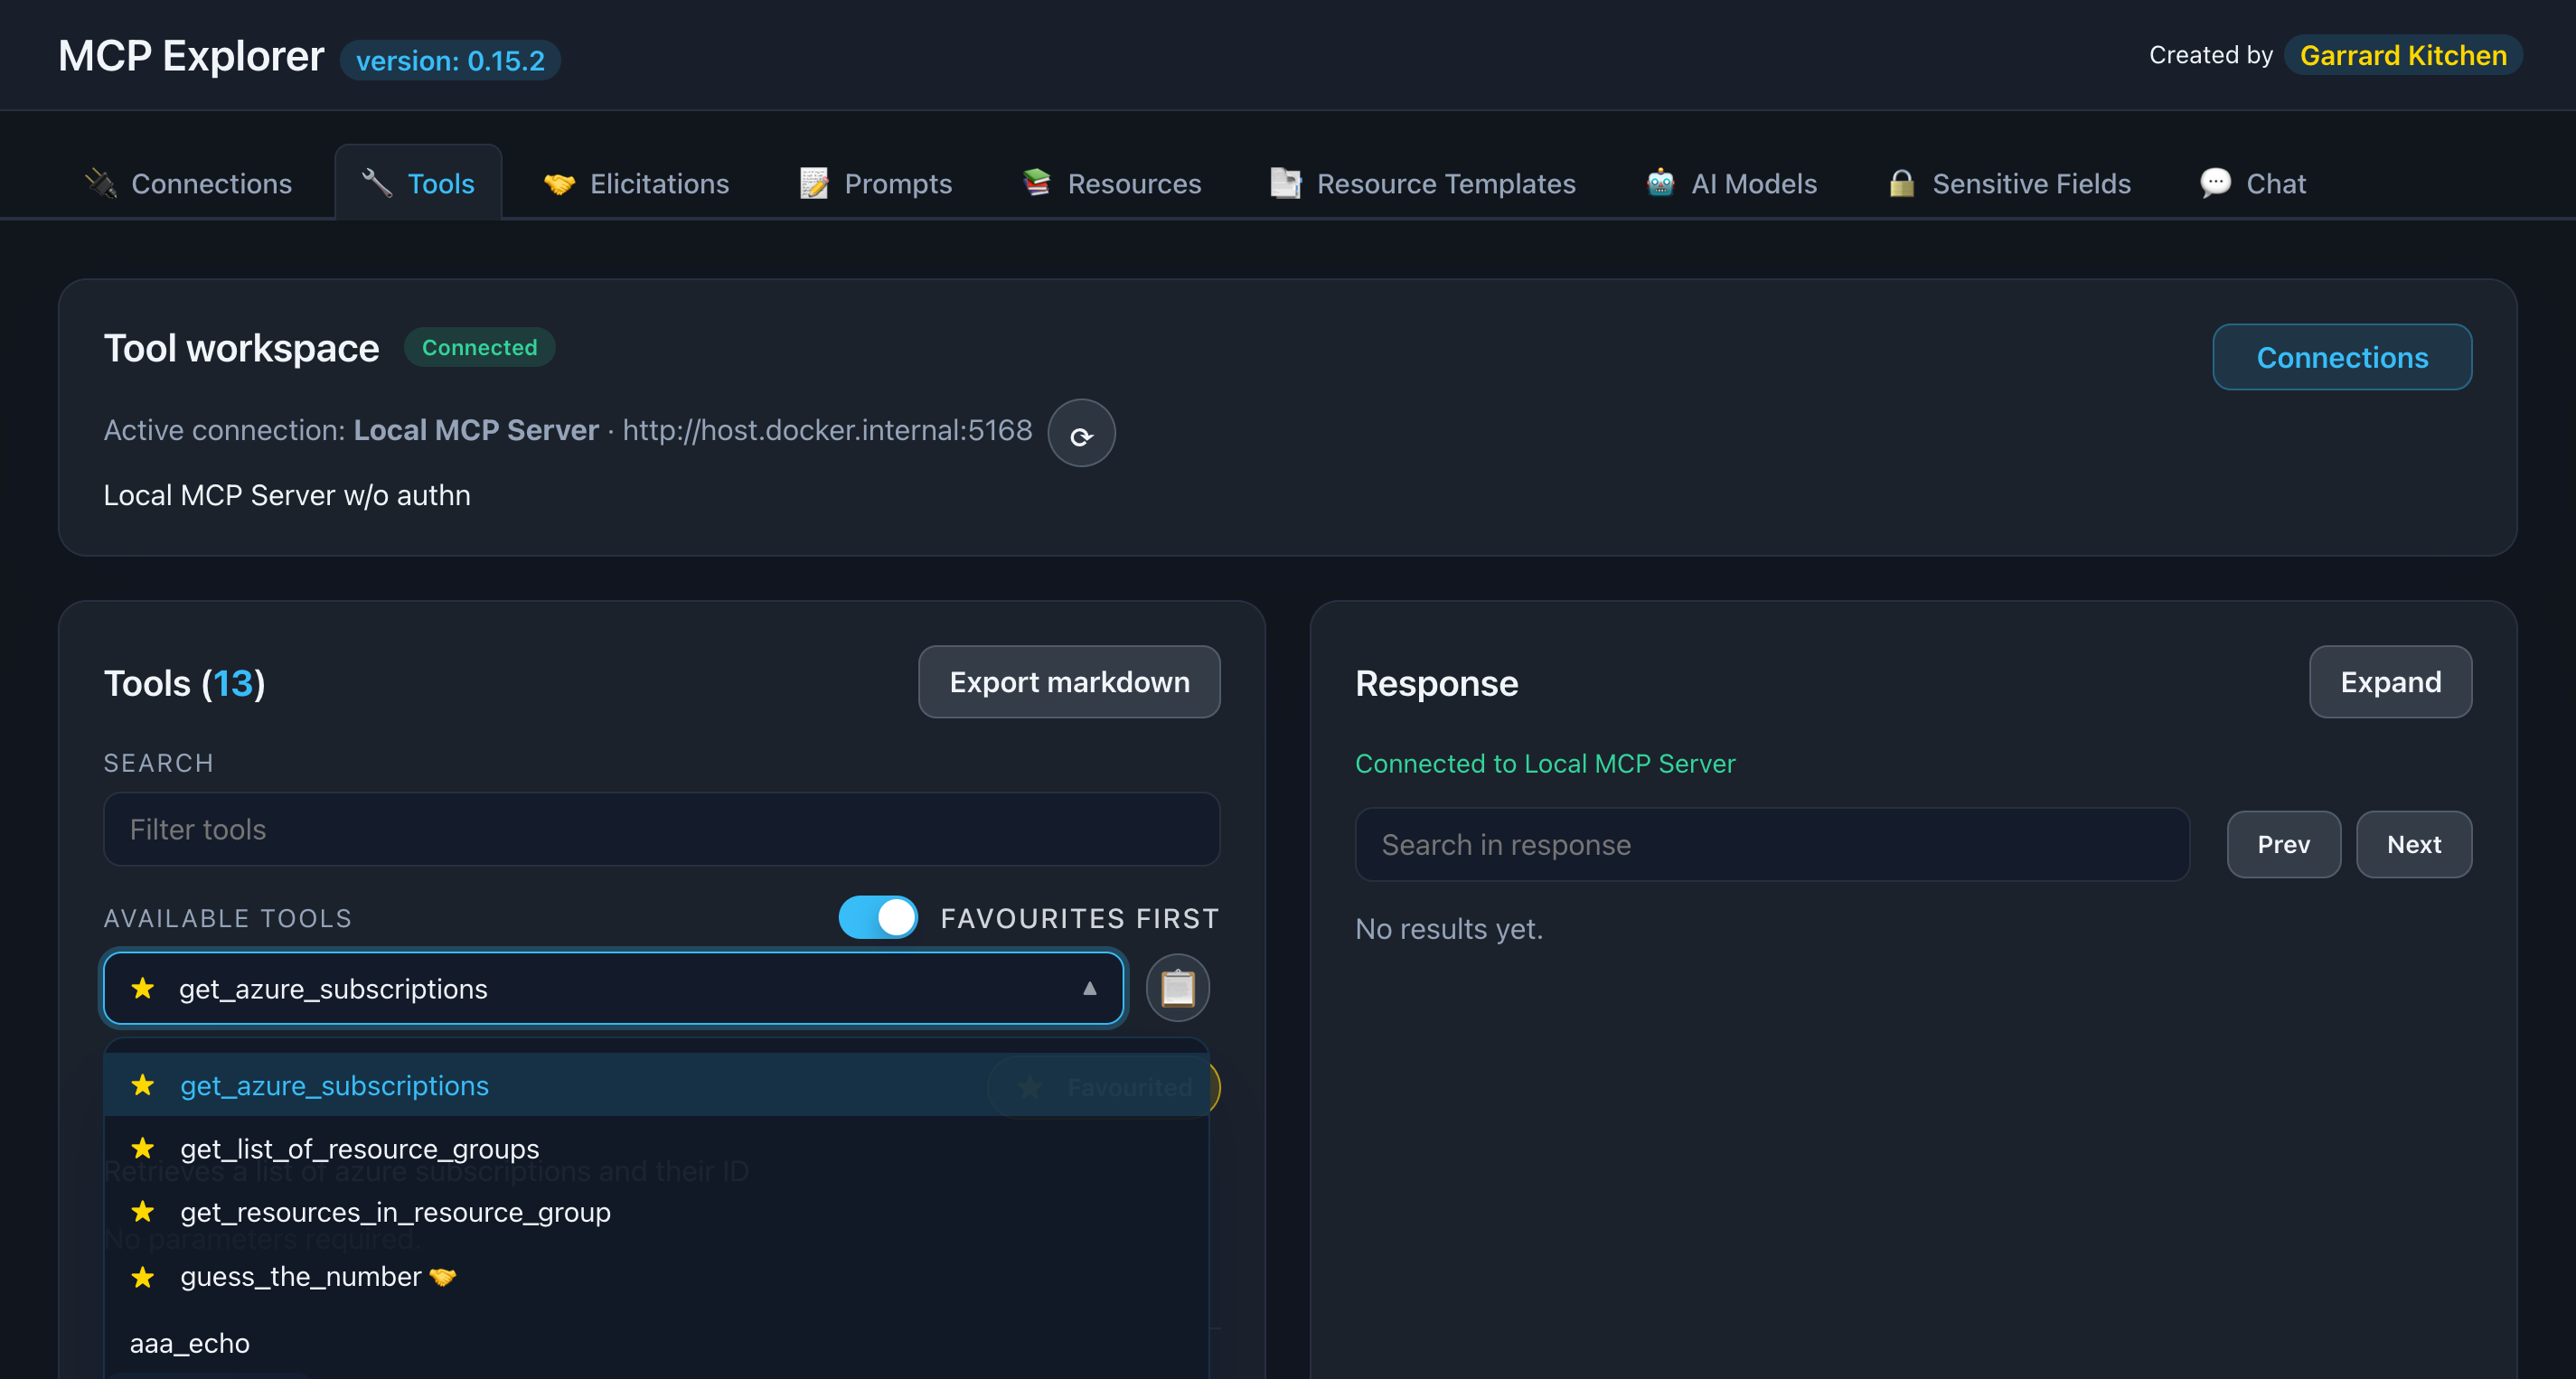
Description: Show the left sidebar with multiple tools listed, including some marked as favorites (with filled stars)
Step 3: Select a Tool
Click any tool to view its details in the main panel:
Tool information displayed:
- Name: The tool identifier
- Description: What the tool does
- Input Schema: Expected parameters and types
- Documentation: Auto-generated from schema
📸 Screenshot:
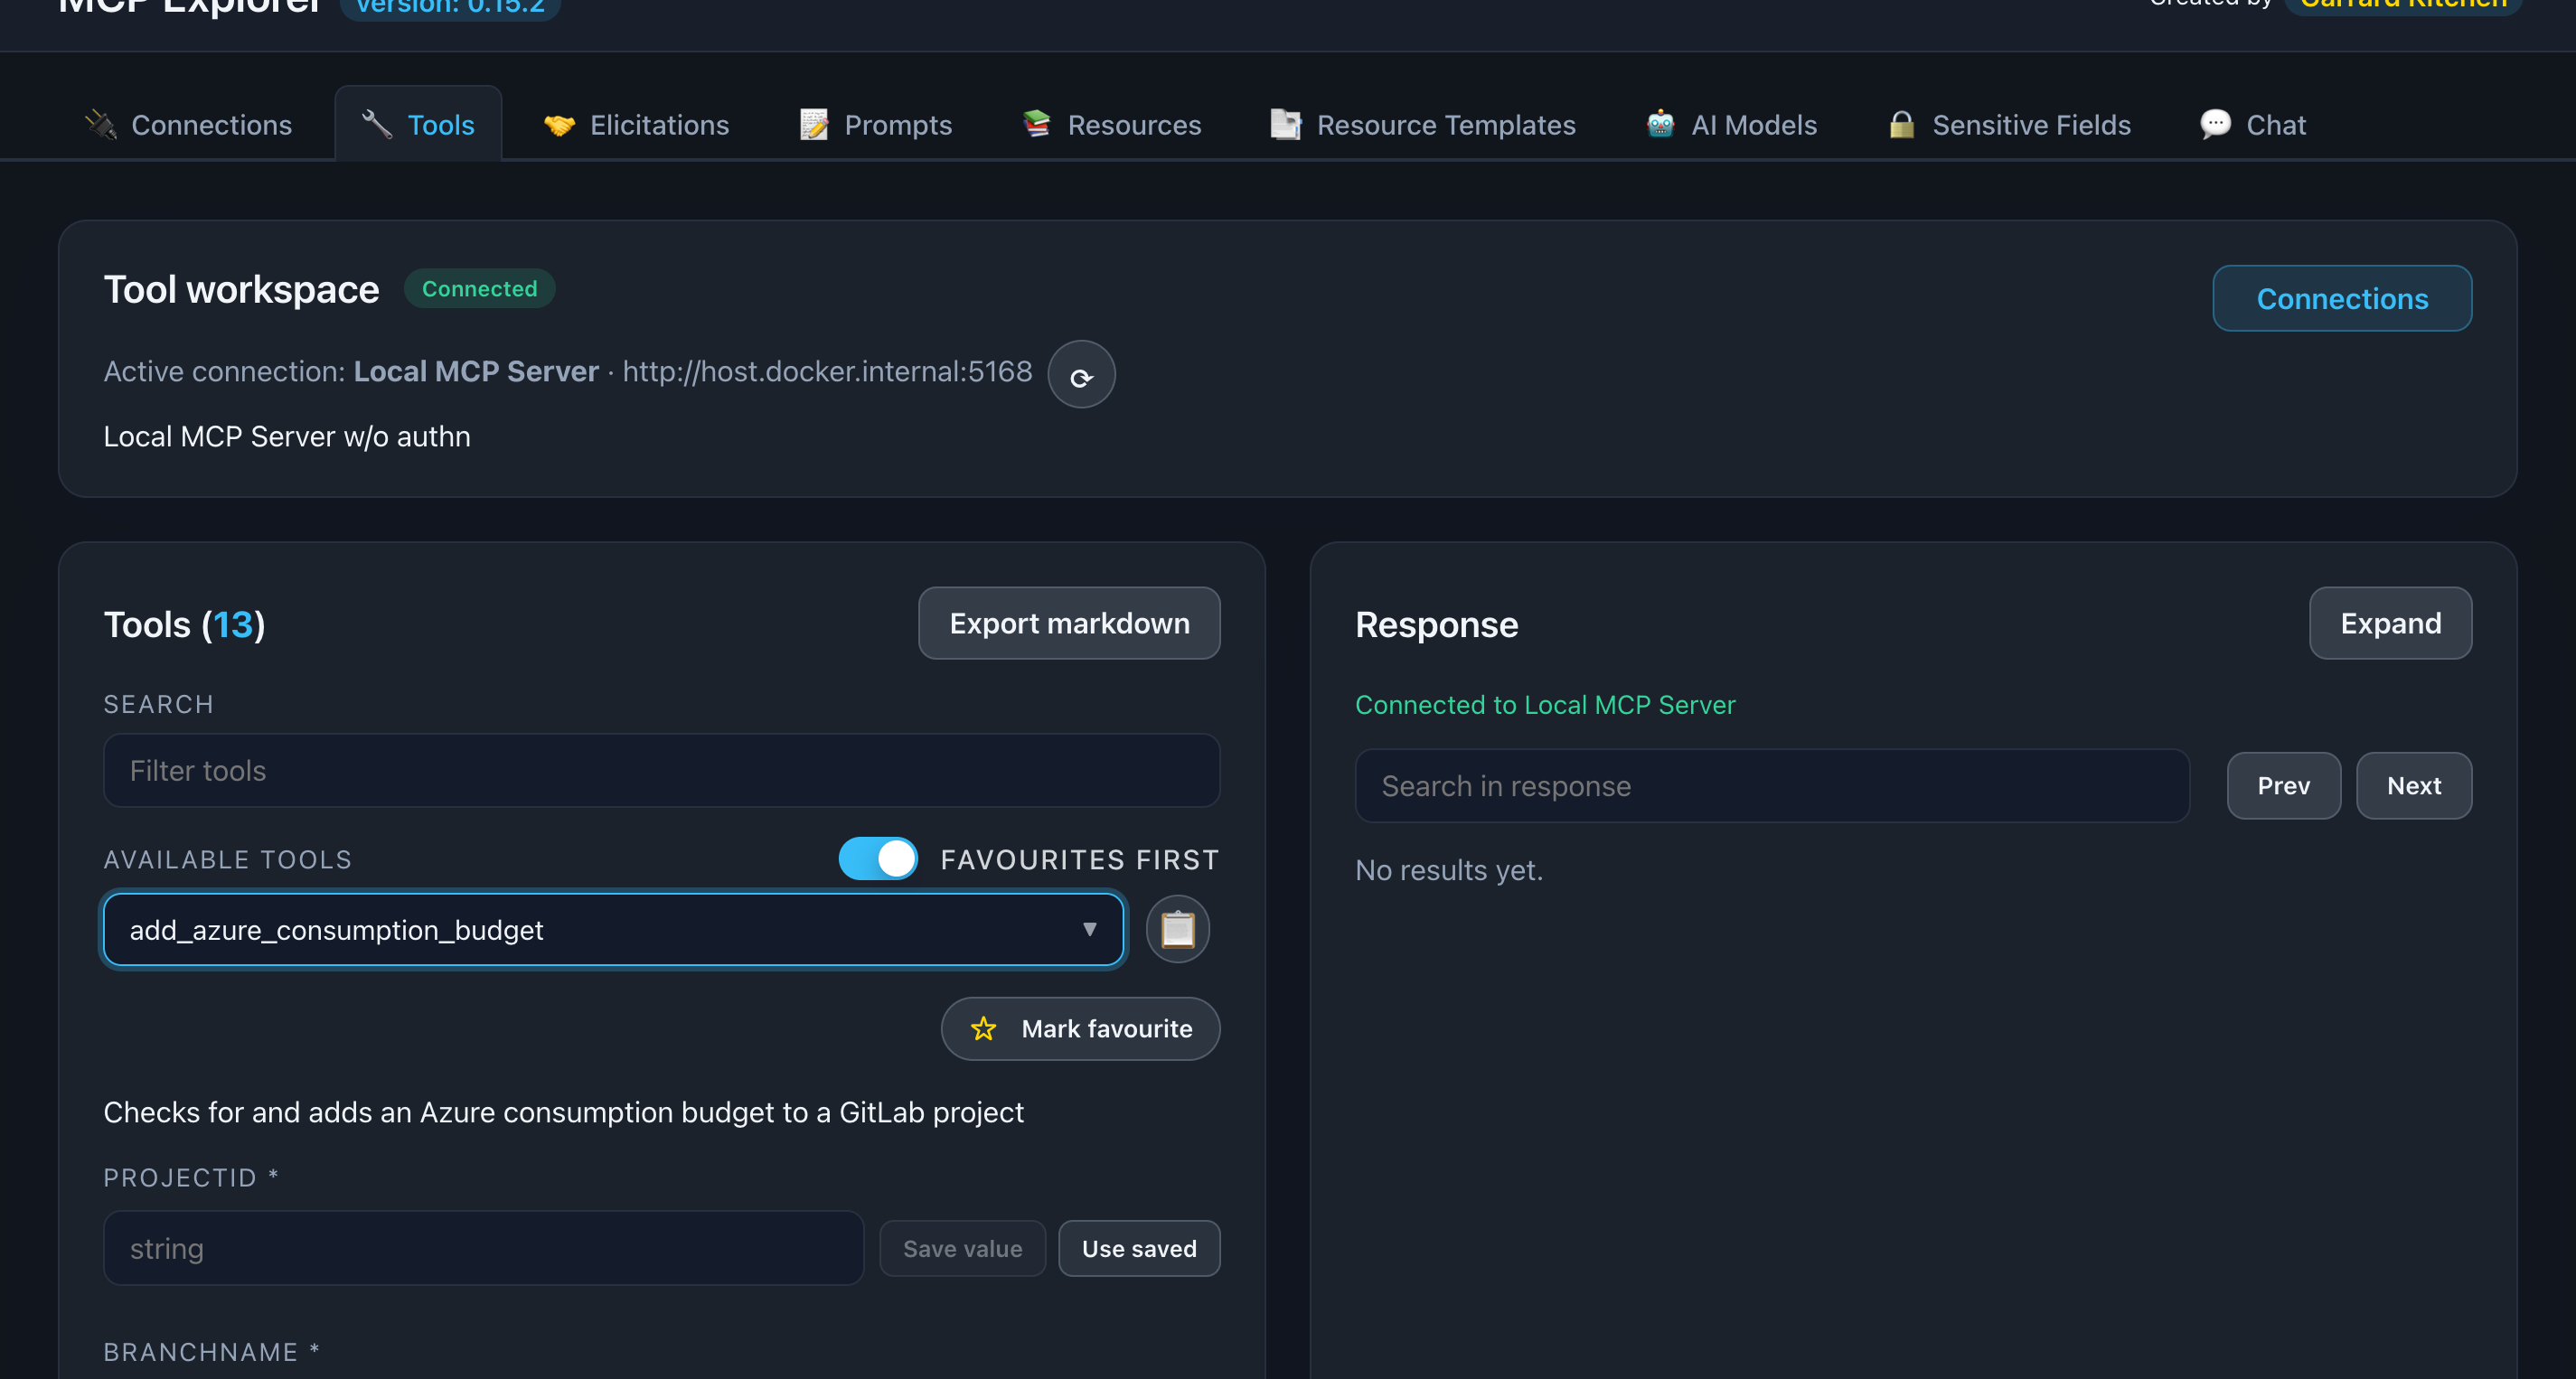
Description: Show a tool selected with its description, parameters section, and the “Call Tool” button visible
Executing Tools
Fill in Parameters
The parameter form is automatically generated from the tool’s input schema.
Supported parameter types:
- String: Text input fields
- Number: Numeric input fields
- Boolean: Checkboxes
- Enum: Dropdown selects
- Object: Nested property fields
- Array: Dynamic list items
📸 Screenshot:
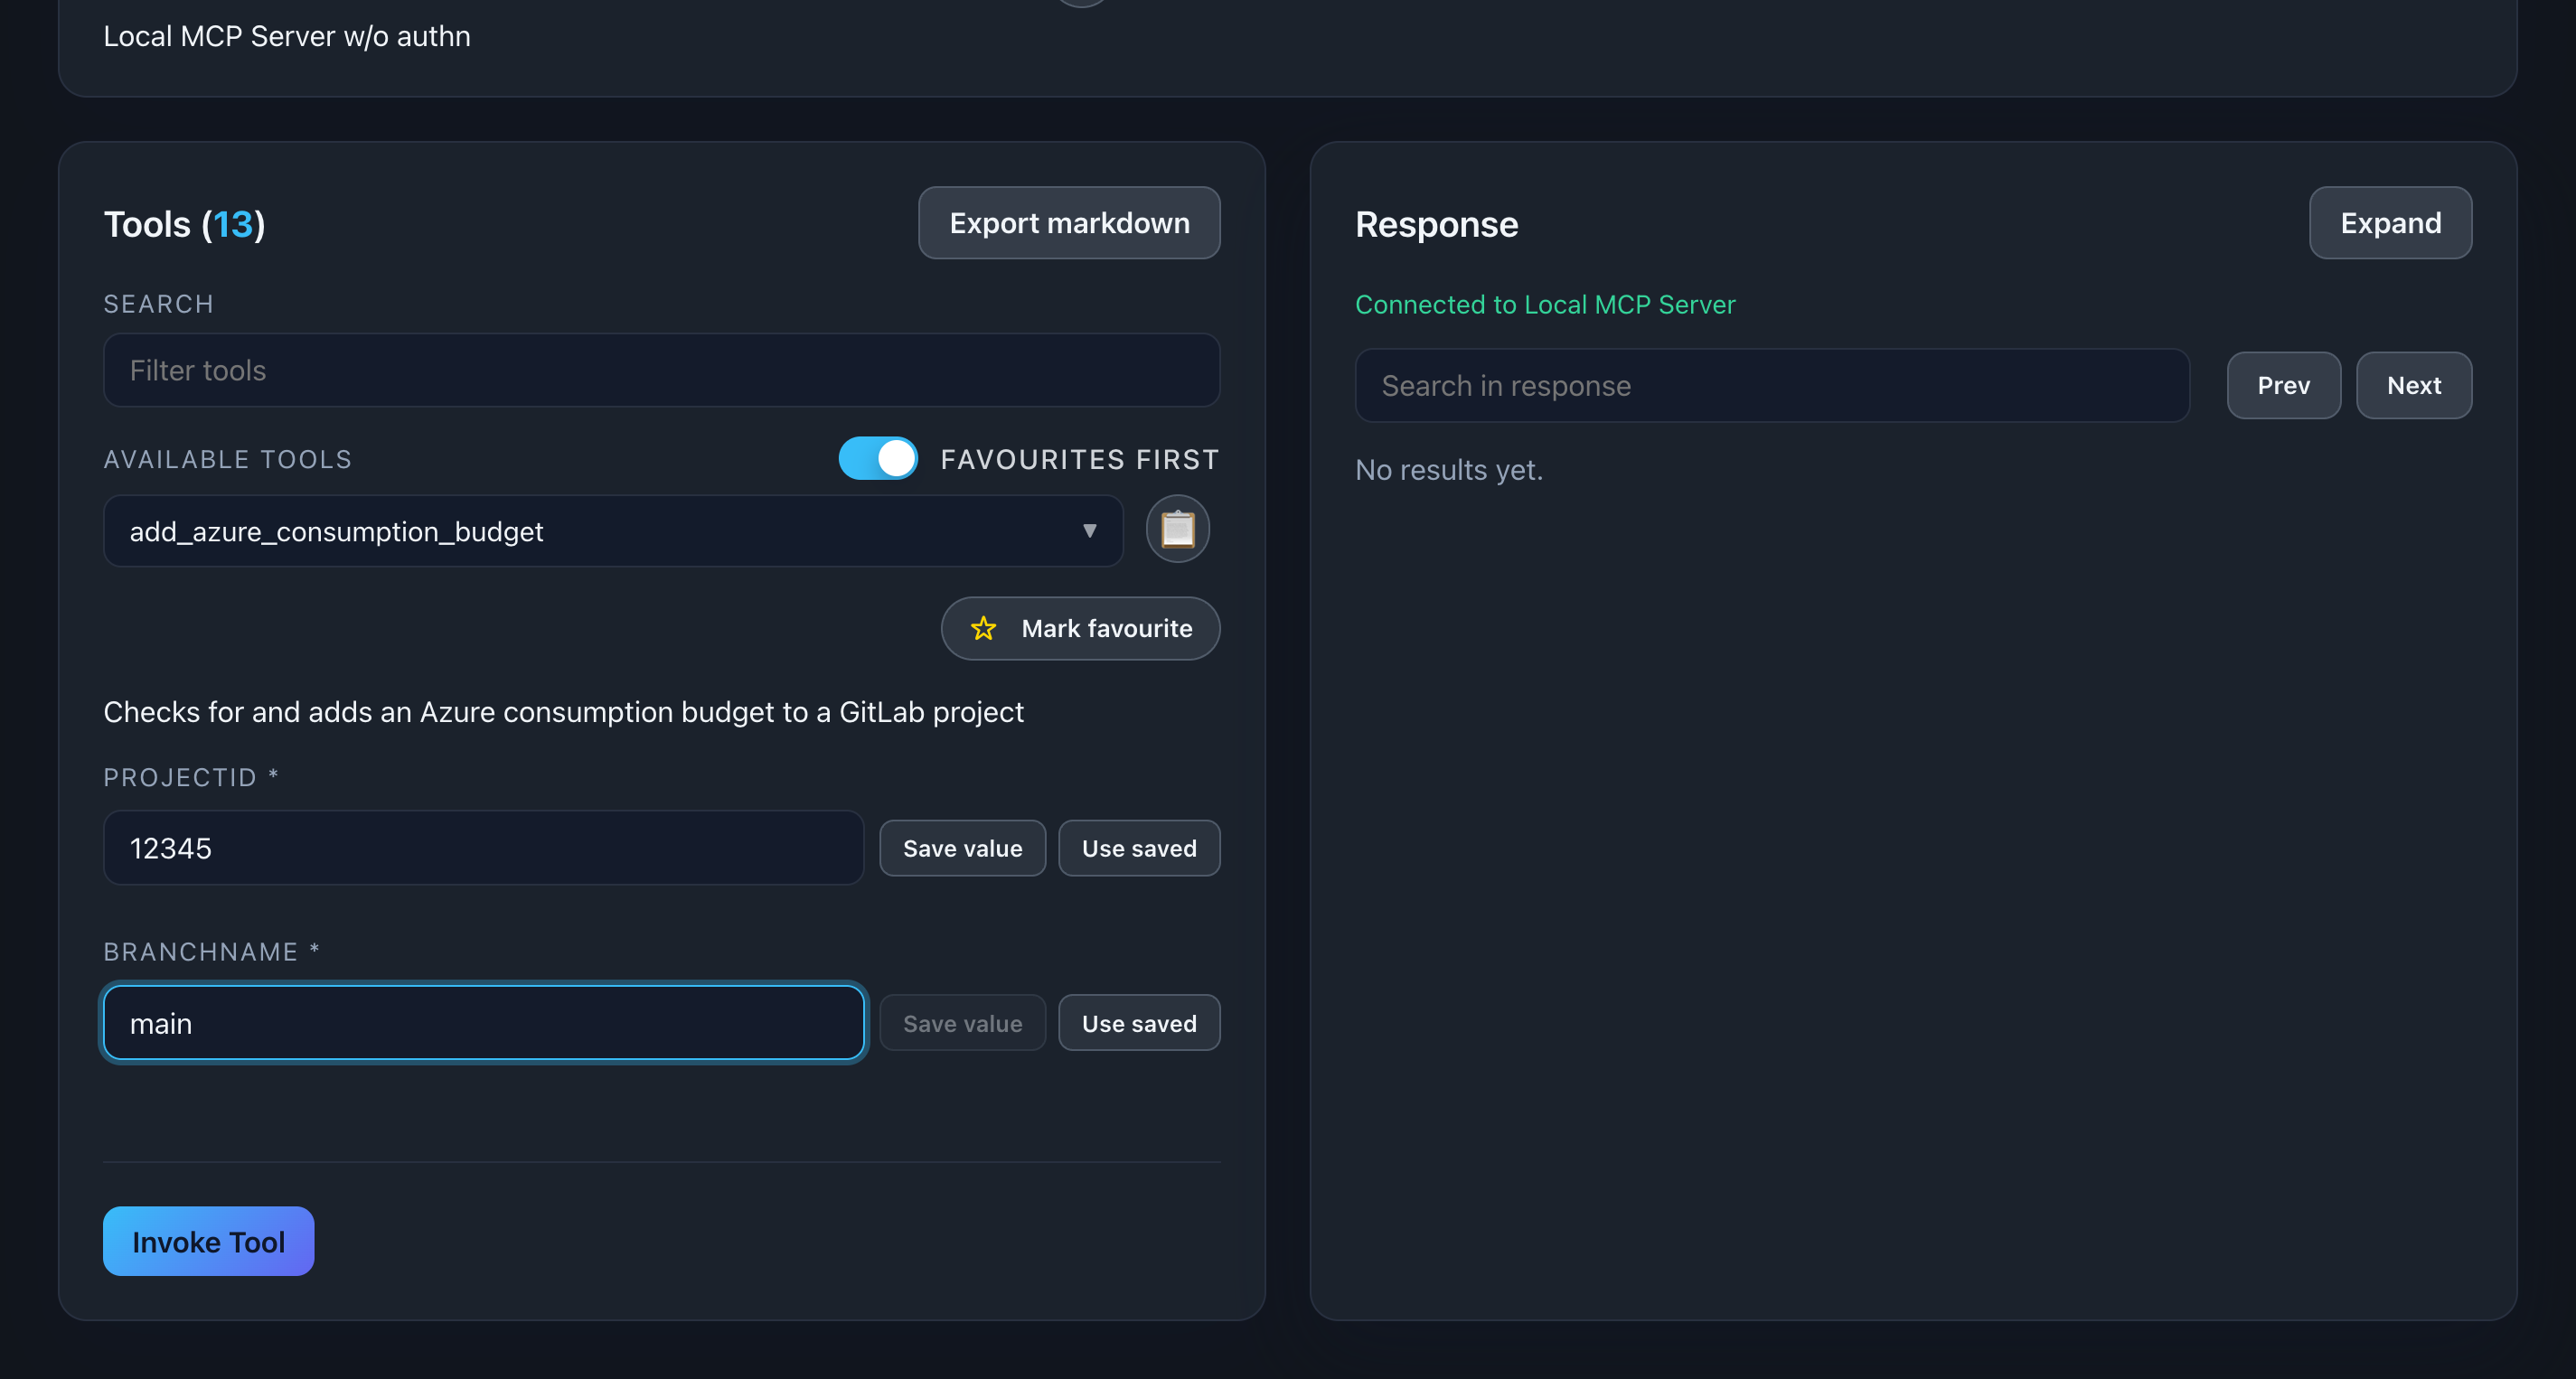
Description: Show a tool with multiple parameters filled in, demonstrating different input types (text, number, dropdown, checkbox)
Parameter Persistence
Press ‘Save value’ to have this value stored for later used.
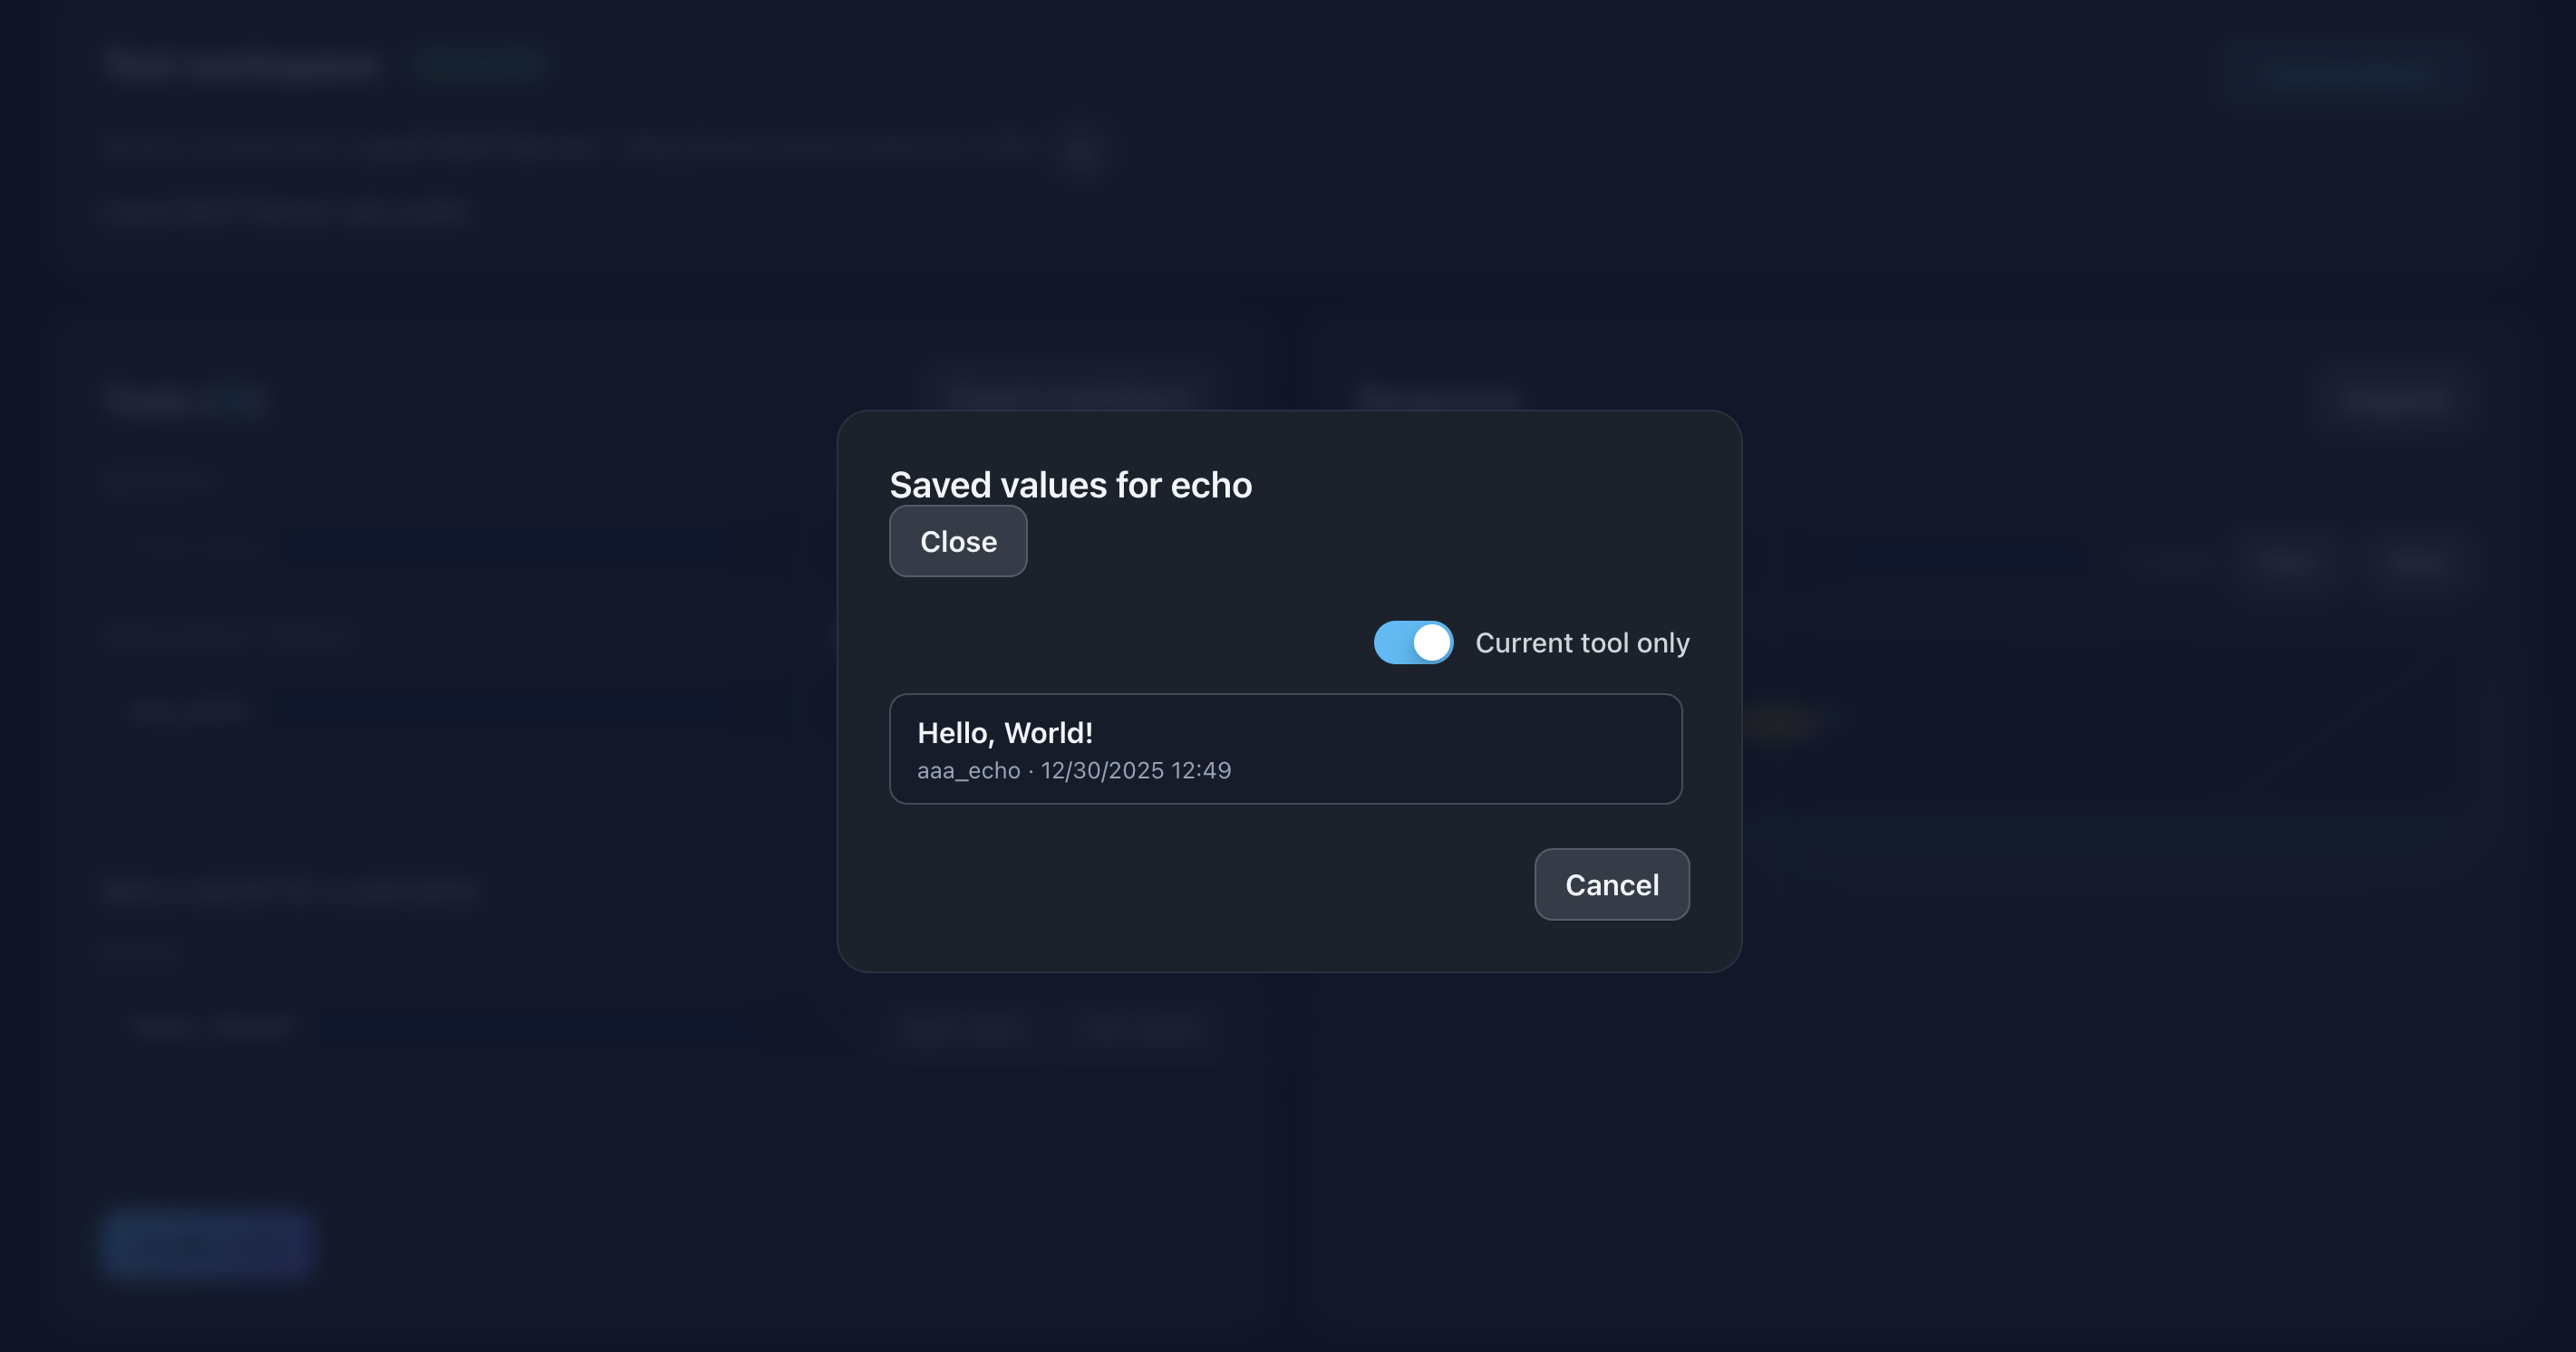
Description: Showing use saved values for this parameter. Ideal for demo scenarios and testing. You can use in other tools where the parameter name is the same
Call the Tool
- Fill in required parameters (marked with *)
- Fill in optional parameters as needed
- Click Call Tool button
- Watch for status indicator (loading spinner)
- View the response below
Execution flow:
Fill Parameters → Click "Call Tool" → Server Executes → Response Displayed
Working with Responses
View Formatted JSON
Responses are displayed as beautifully formatted, color-coded JSON.
Features:
- Syntax highlighting (keys, strings, numbers, booleans, null)
- Collapsible nested objects/arrays
- Copy to clipboard
- Fullscreen view
📸 Screenshot:
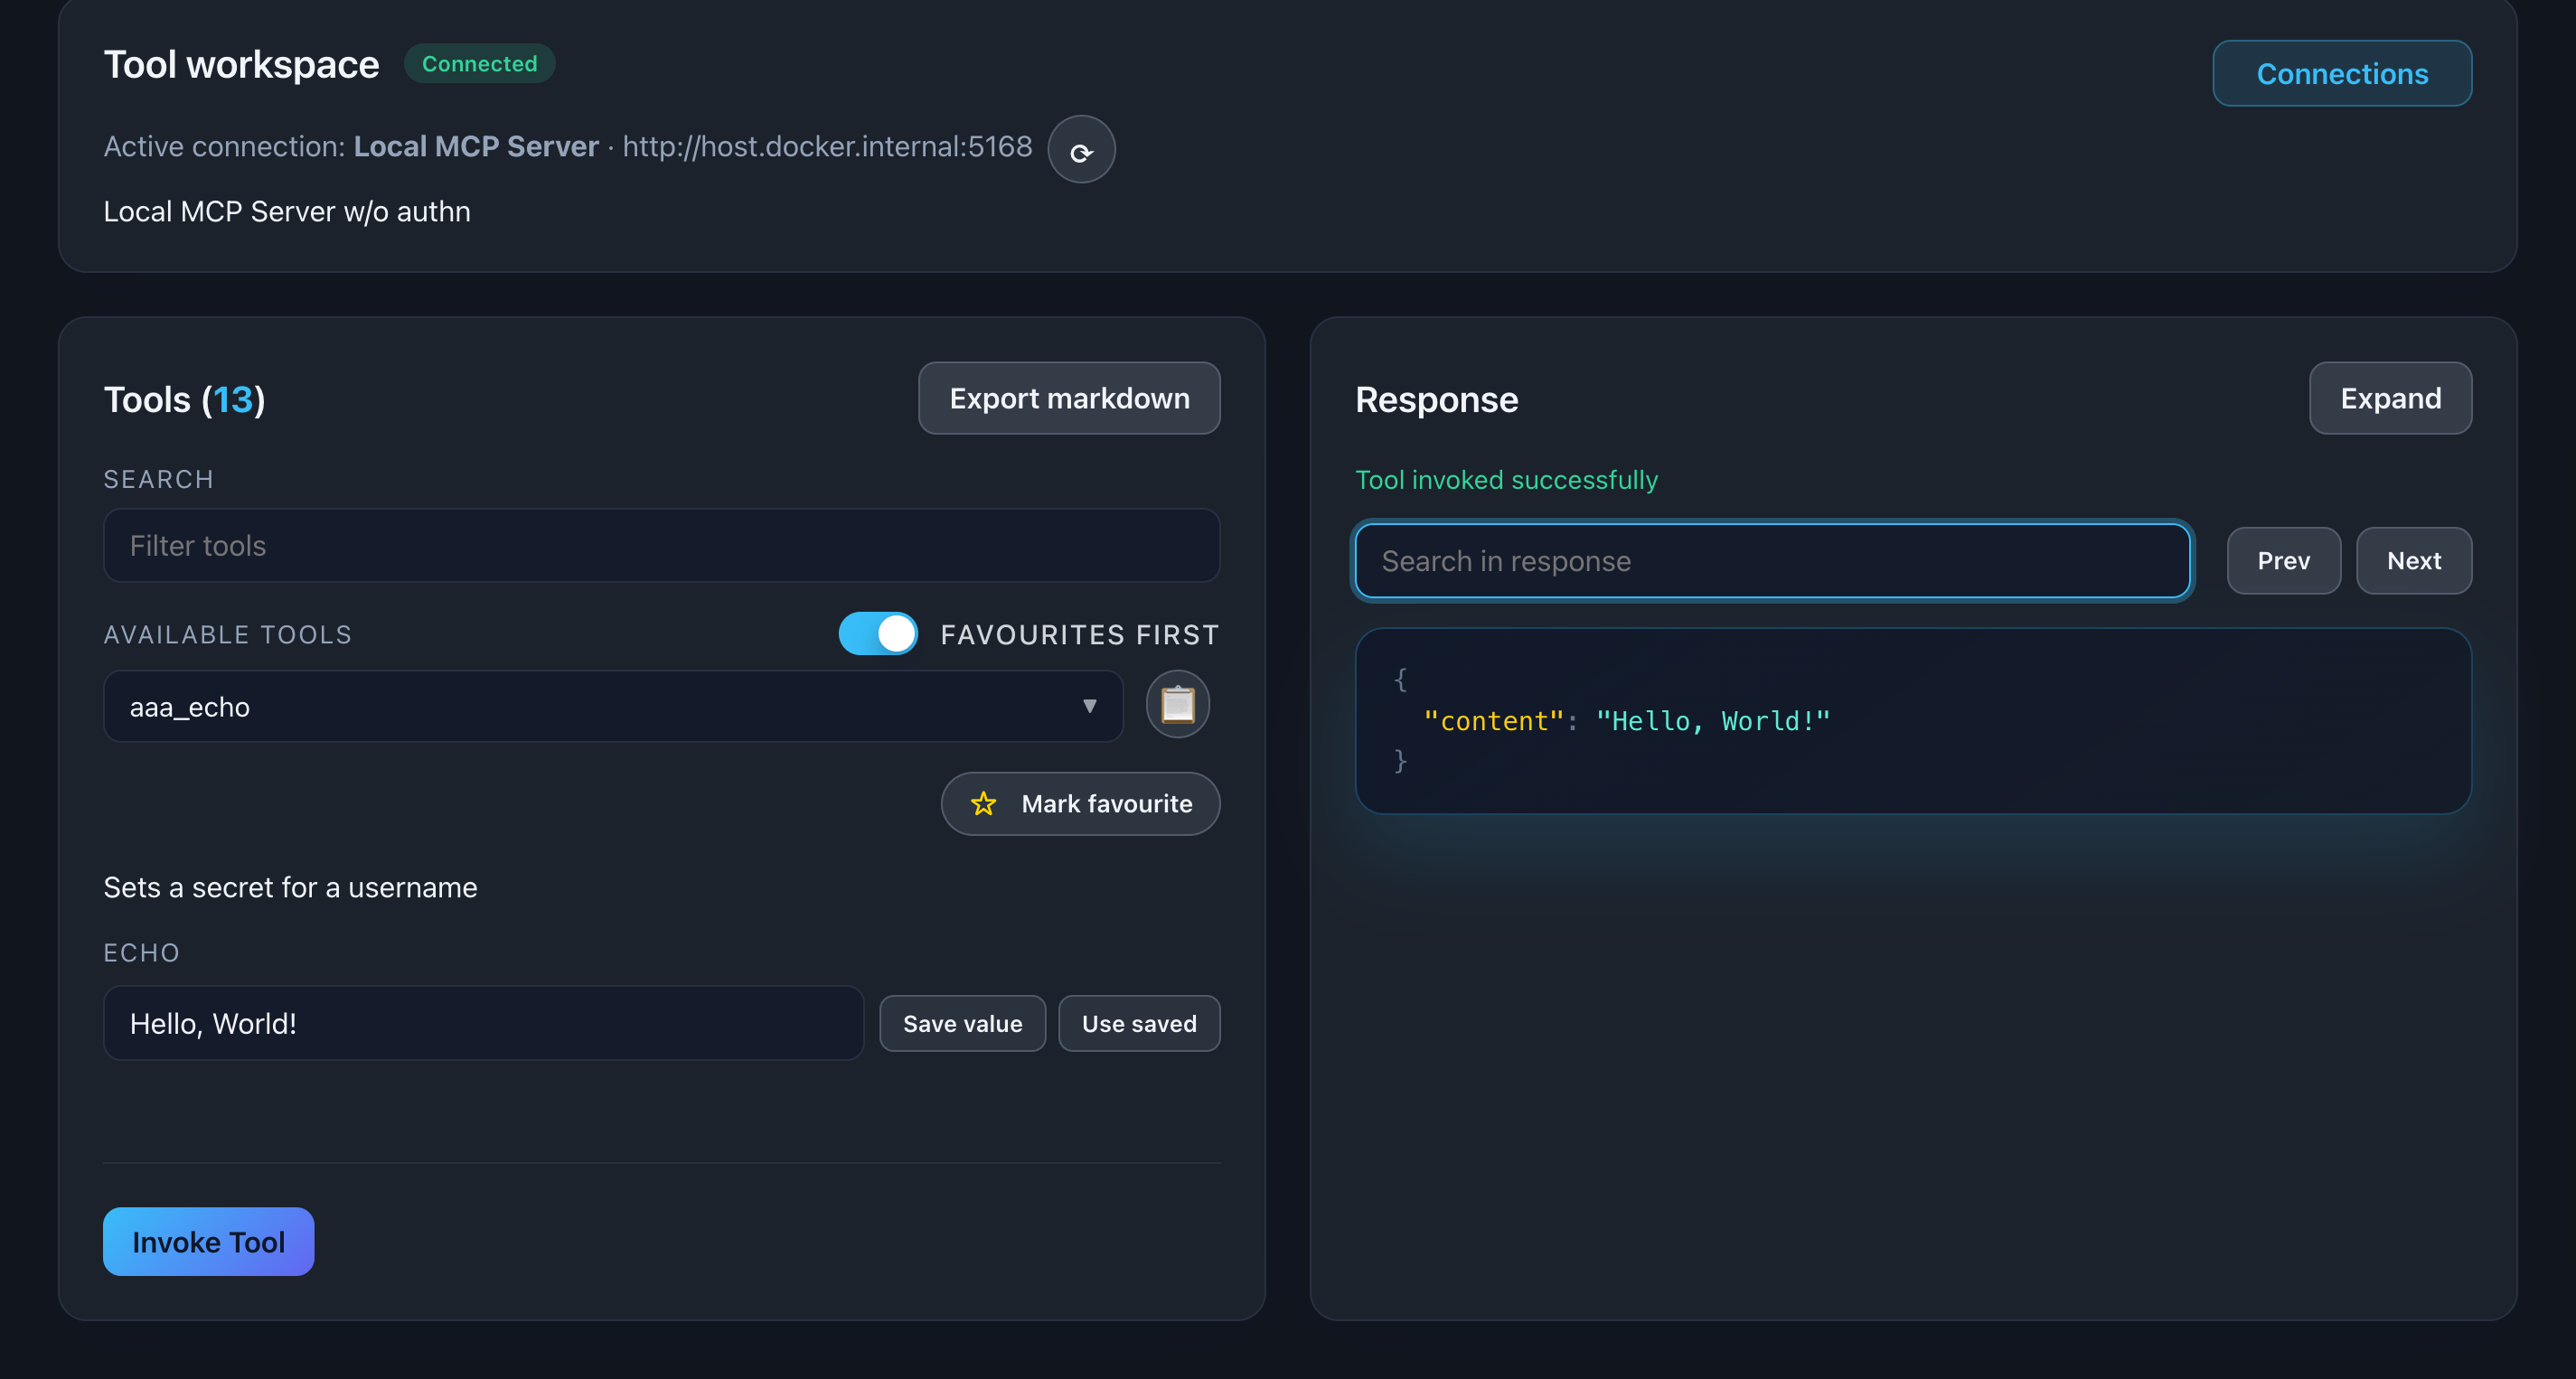
Description: Show a tool response with formatted JSON, highlighting the color-coding and structure
Search Response Content
Use the search box at the top of the response viewer to filter JSON content in real-time.
Search behavior:
- Matches keys and values
- Highlights matching text
- Case-insensitive
- Instant filtering
Use cases:
- Find specific error codes
- Locate nested properties
- Filter large response arrays
- Debug specific fields
📸 Screenshot:
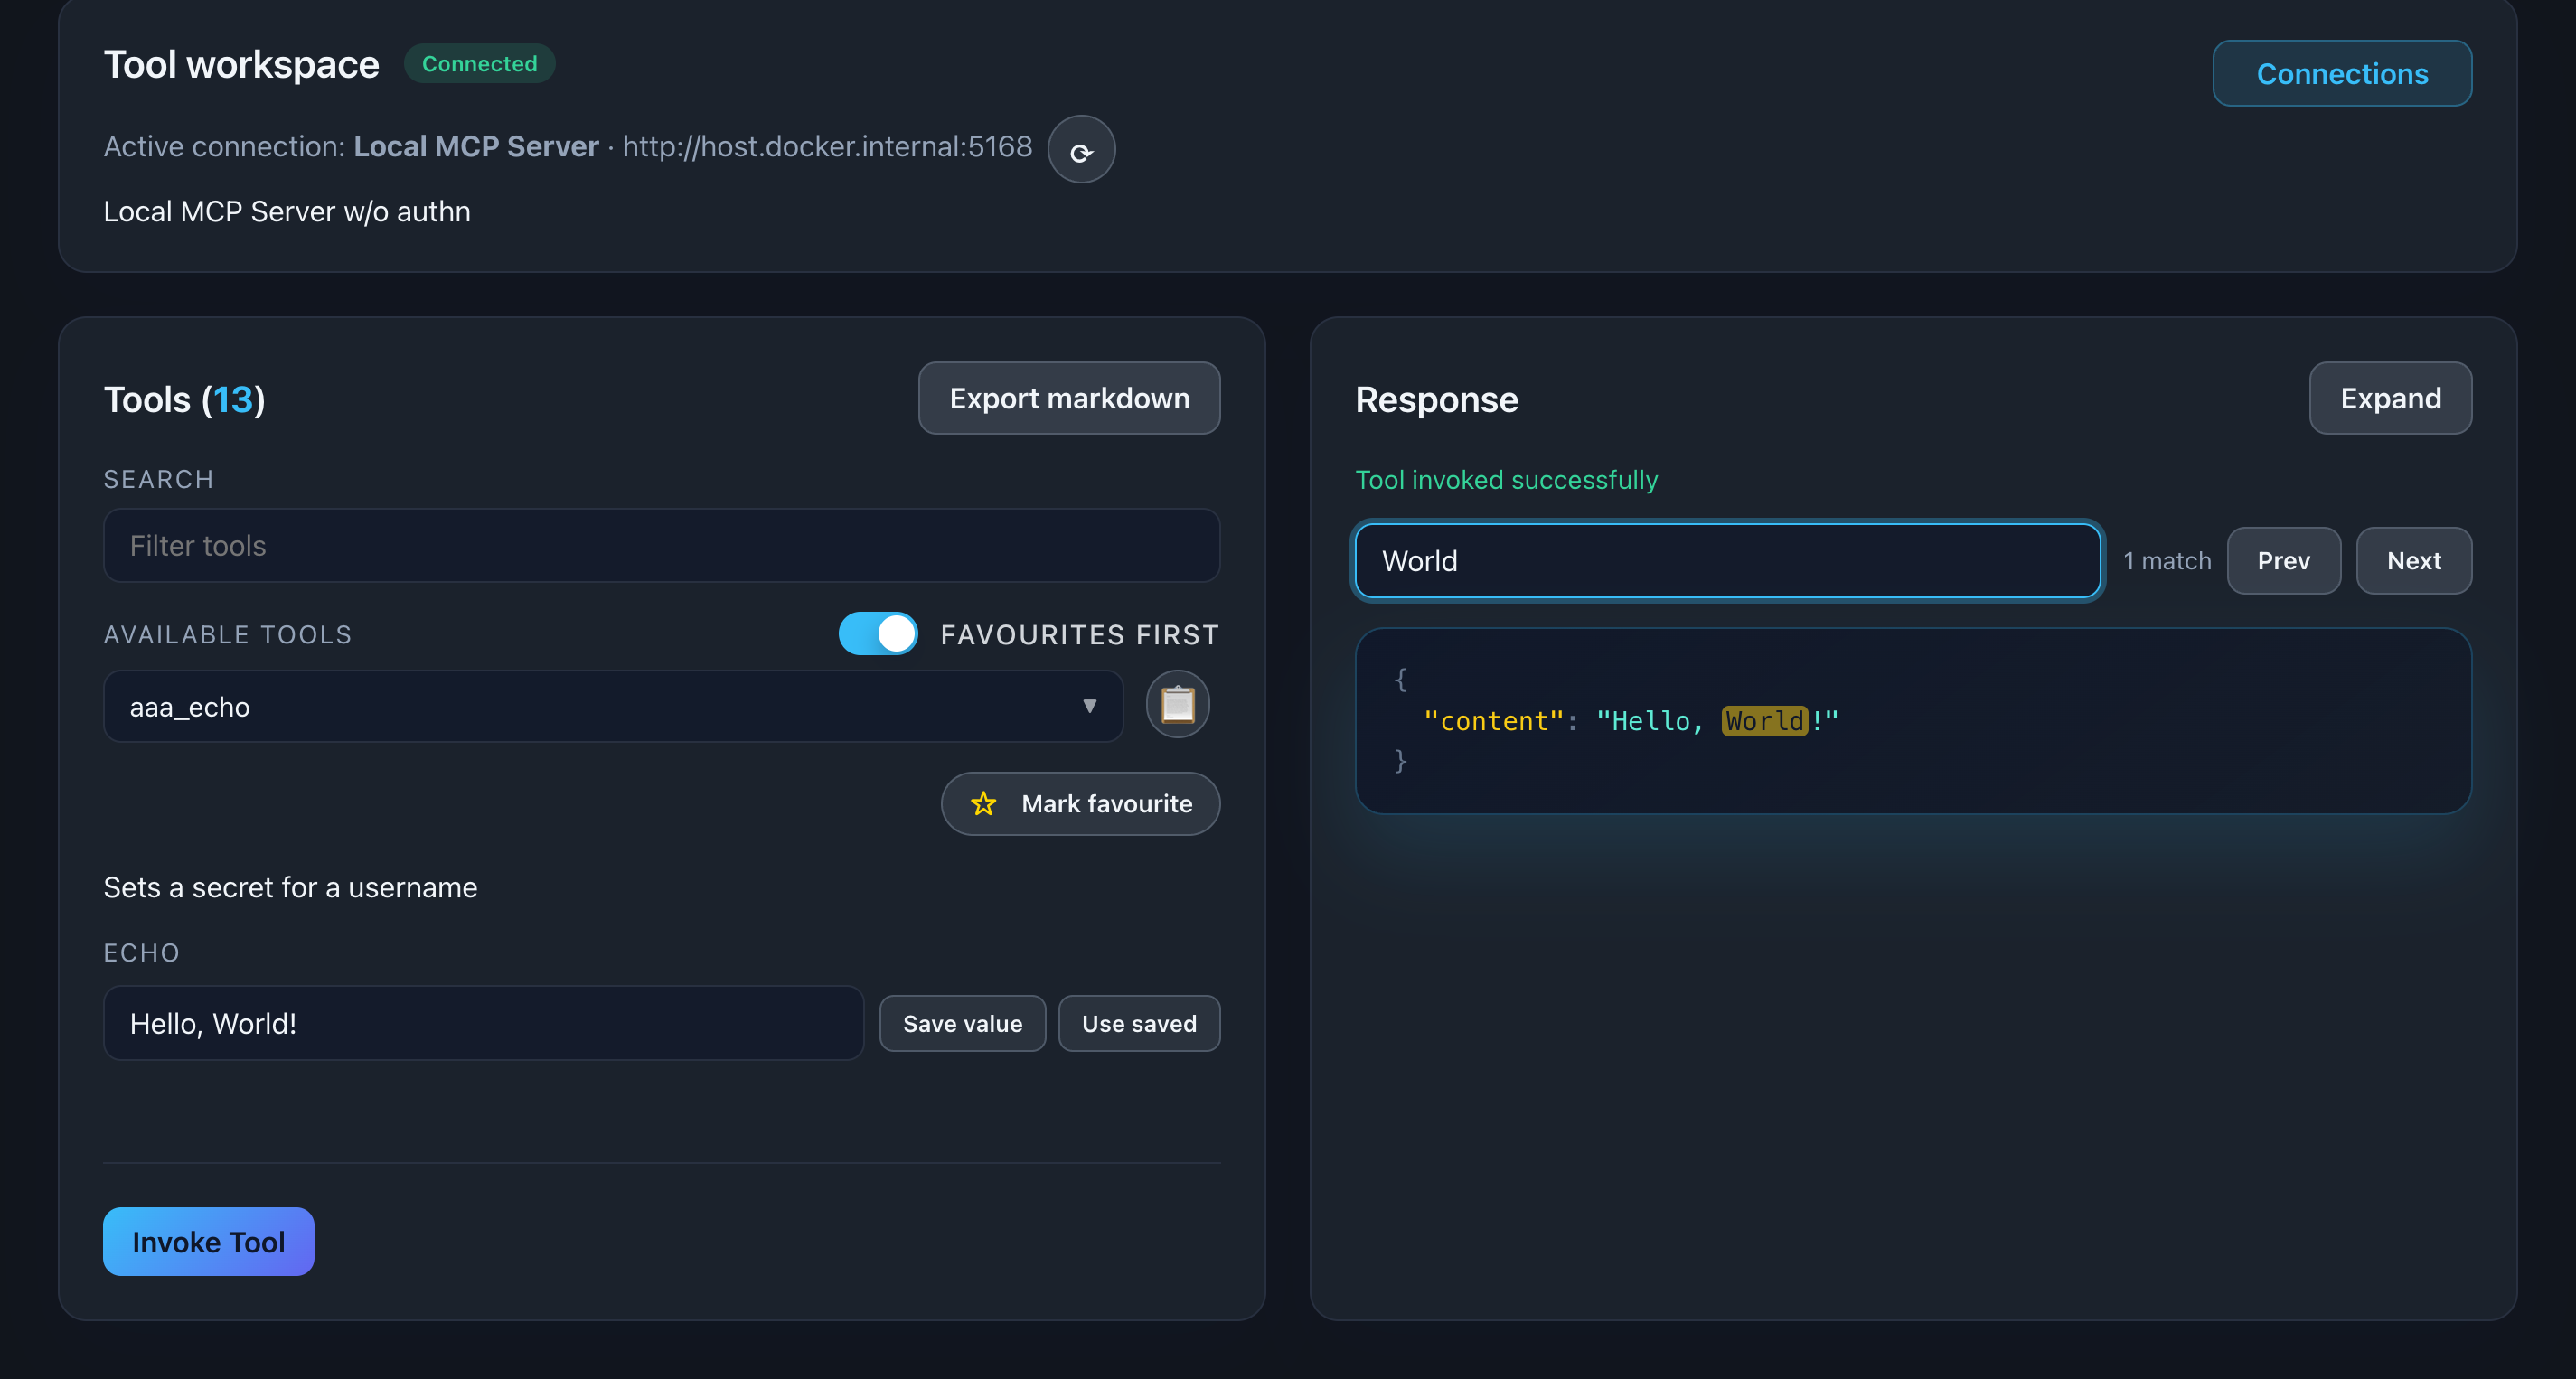
Description: Show the response viewer with a search term entered and matching text highlighted in yellow
Fullscreen Mode
Click the fullscreen icon (⛶) in the response viewer toolbar to expand the JSON view.
Benefits:
- Focus on response data
- View deeply nested structures
- Better readability for large responses
- Press ESC or click again to exit
📸 Screenshot:
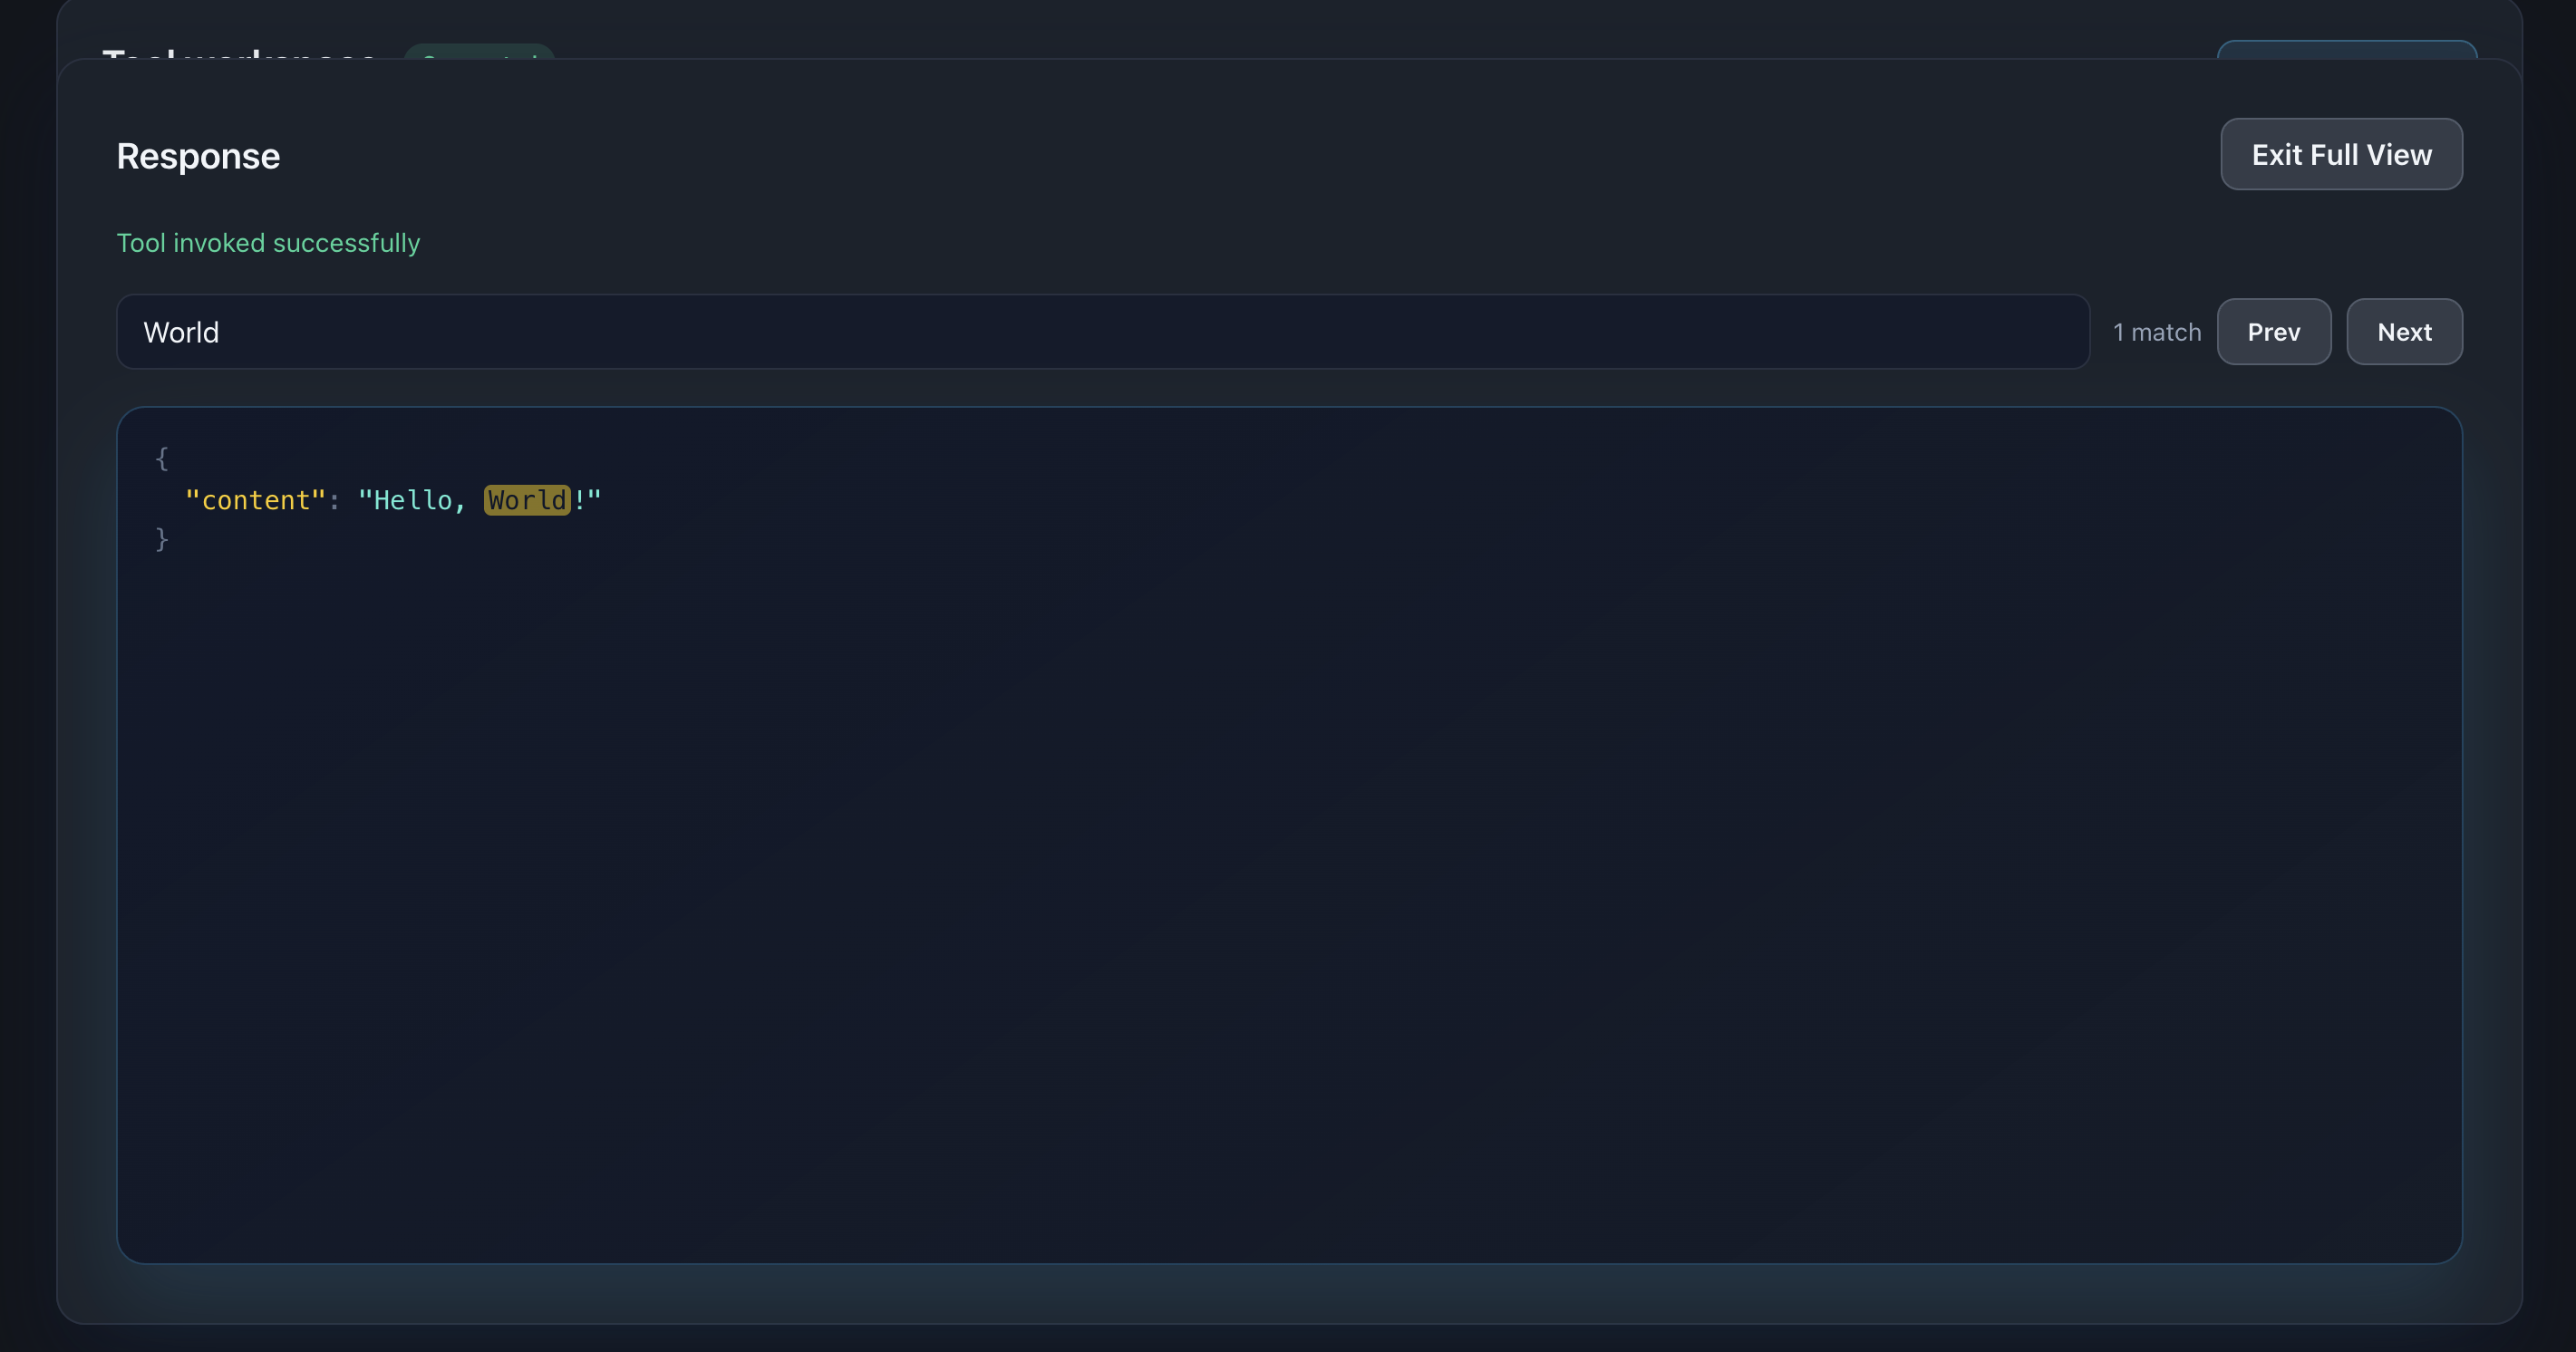
Description: Show the fullscreen JSON viewer with a large response displayed
Advanced Features
Favorites Management
Mark tools you use frequently as favorites for quick access.
To add a favorite:
- Click the star icon (☆) next to a tool name
- Star fills in (★) to indicate it’s favorited
To view favorites only:
- Use the search/filter options (if available)
- Favorites appear at the top of the list
To remove a favorite:
- Click the filled star (★)
- Star empties (☆) to indicate it’s unfavorited
Copy Tool Names
Quickly copy tool names to use in code, documentation, or chat.
How to copy:
- Select a tool
- Click the copy icon (📋) or copy button
- Tool name is copied to clipboard
- Use in prompts, code, or other tools
Use cases:
- Reference tools in chat messages
- Document which tools were tested
- Share tool names with team members
- Use in scripts or automation
Parameter History
MCP Explorer remembers your last used values for each tool.
Behavior:
- Values persist across sessions
- Separate history per tool
- Encrypted storage for sensitive values
Benefits:
- Faster re-testing with same inputs
- No need to re-enter common values
- Streamlined debugging workflow
Auto-Generated Documentation
Each tool automatically displays its complete schema.
Documentation includes:
- Tool name and description
- Parameter names and types
- Required vs optional fields
- Enum values (for dropdowns)
- Default values
- Nested object/array structures
📸 Screenshot:
Description: Show a tool’s parameter section displaying the schema information, highlighting required fields and descriptions
Common Workflows
Testing a New Tool
- Connect to server
- Find tool in list or use search
- Read the auto-generated documentation
- Fill in minimal required parameters
- Execute and inspect response
- Adjust parameters and re-test
- Mark as favorite if frequently used
Debugging Tool Behavior
- Execute tool with known-good parameters
- Inspect the JSON response structure
- Use search to find specific error codes or fields
- Modify parameters to test edge cases
- Compare responses between executions
- Copy tool name for reference in bug reports
Building Tool Call Chains
- Execute first tool to get data
- Copy relevant values from response
- Select second tool
- Paste values into parameters
- Execute and verify chained behavior
Troubleshooting
Tool List is Empty
Problem: No tools appear after connecting
Solutions:
- Verify server is actually connected (check status indicator)
- Ensure the server implements MCP tools capability
- Check server logs for errors
- Disconnect and reconnect
Tool Execution Fails
Problem: Error message or timeout when calling tool
Solutions:
- Verify all required parameters are filled
- Check parameter value types match schema
- Review server logs for detailed errors
- Test with minimal/default parameters first
- Check authentication headers are correct
Response Not Displaying
Problem: Tool executes but no response shown
Solutions:
- Check browser console for JavaScript errors
- Verify tool actually returns data
- Test with a simpler tool first
- Clear browser cache and reload
Parameters Not Saving
Problem: Parameter history doesn’t persist
Solutions:
- Ensure browser allows localStorage
- Check that settings file is writable
- Verify you’re using same browser profile
- Review console for permission errors
Tips & Best Practices
🎯 Use Favorites
Mark your most-used tools to save time navigating large tool lists.
🔍 Search First
Use the search box before scrolling through long tool lists.
📋 Keep Test Data
Save sample parameter values in a separate document for quick copy/paste testing.
🔄 Test Edge Cases
Try empty strings, null values, and boundary conditions to verify server validation.
📸 Screenshot Responses
Capture important responses for documentation or bug reports.
🔗 Chain Tools
Use output from one tool as input to another to test complex workflows.